# packages
library(tidyverse)
library(devtools)

# theme
theme_set(theme_minimal())We begin with creating or importing a simple, three-column data frame into R with the following variables:
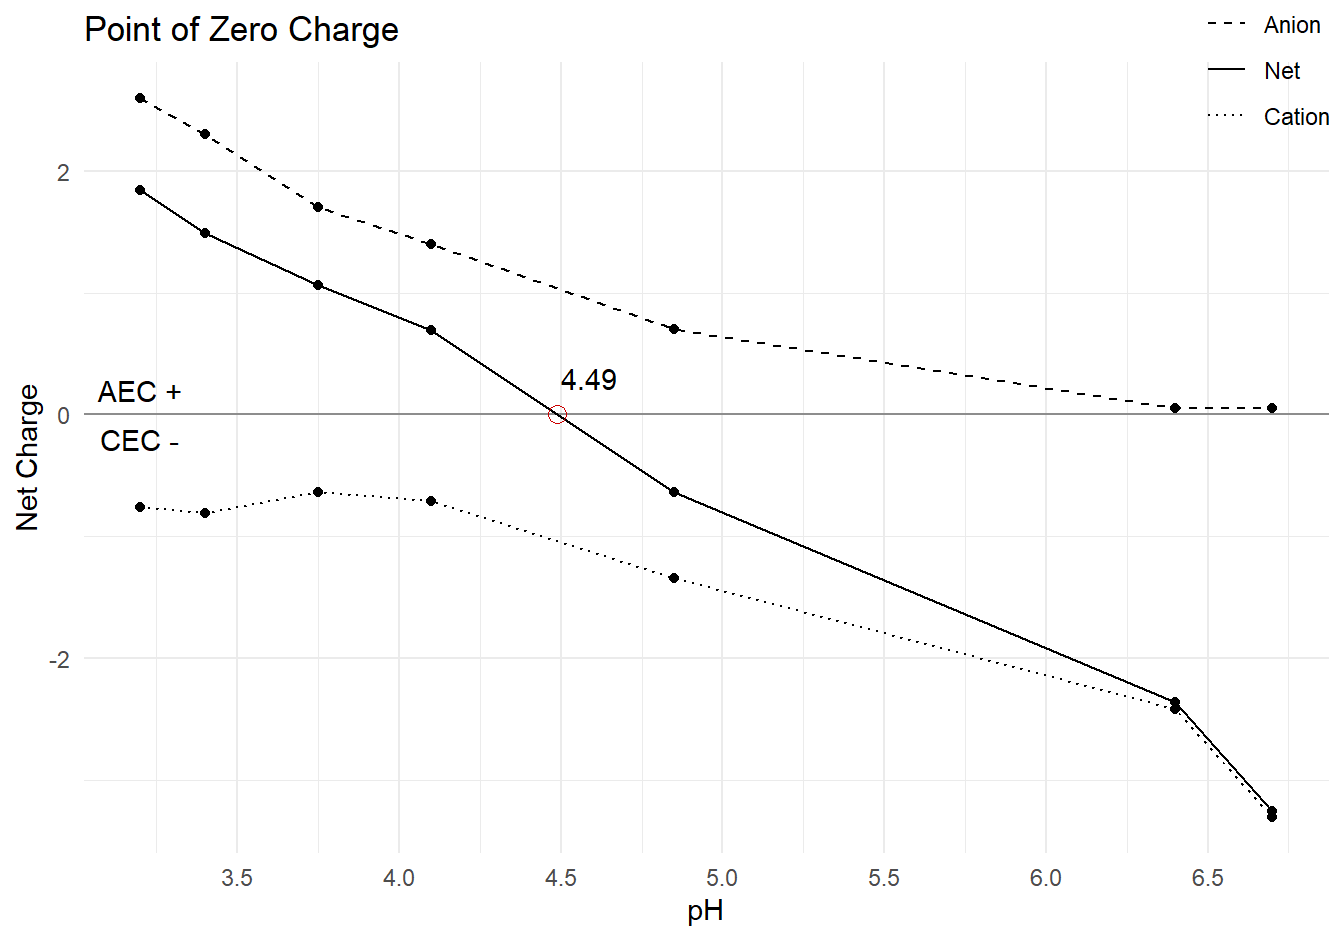
pH- pH measurements in the first columnAnion- Anion exchange measurements in the second columnCation- Cation exchange measurements in the third (and last) column
Or if you want to use the R code only, just input your PZC data manually into the respective strings (ph, anion, and cation). Make sure to fill out the strings in order of the observations, starting with the first PZC measurement. For this all to work, I might add, your cation exchange values will be positive when recorded, but it’ll be treated as negative during the calculation.
raw <- tibble(pH    =  c(3.2,  3.4,  3.75, 4.1,  4.85, 6.4,   6.7),
              Anion  =  c(2.6,  2.3,  1.7,  1.4,  0.7,  0.055, 0.052),
              Cation = -c(0.76, 0.81, 0.64, 0.71, 1.34, 2.42,  3.31))
The net charge is the difference between the anion and cation charges. Anion exchange capacity has positive net charge. Cation exchange capacity has negative net charge. Once net charge is calculated, arrange the data frames and sort by the net charge in descending order.
pzc_data <-
  raw %>%
  mutate(Net = Anion + Cation) %>%
  arrange(desc(Net))
This code finds the exact point of zero charge, so that 1) it can be known exactly rather than eye-balling the plot, and 2) it can be plotted.
# find pzc by calculating slope of line between last positive (AEC) point
pos <-
  pzc_data %>%
  filter(Net > 0) %>%
  select(pH, Net) %>%
  tail(n = 1)

# and first negative (CEC) point
neg <-
  pzc_data %>%
  filter(Net < 0) %>%
  select(pH, Net) %>%
  head(n = 1)

# and finding point of x-intercept
pzc <- ((0 - pos$Net) / ((neg$Net - pos$Net) / (neg$pH - pos$pH))) + pos$pH

pzc_label <- round(pzc, digits = 2)
Then, plot PZC.
pzc_data %>%
  pivot_longer(cols = Anion:Net,
               names_to = "Measure",
               values_to = "Value") %>%
  mutate(Measure = factor(Measure, levels = c('Anion', 'Net', 'Cation'))) %>%
  ggplot(aes(x = pH, y = Value, linetype = Measure)) +
  geom_line() +
  geom_point() +
  # zero line
  geom_hline(yintercept = 0,
             alpha = 0.4) +
  # PZC point
  geom_point(aes(x = pzc, y = 0),
             color = "#CC0000",
             size = 3,
             pch = 1) +
  # annotations for labels
  annotate(geom = 'text',
           label = pzc_label,
           x = pzc + 0.1, y = 0.3) +
  annotate(geom = 'text',
           label = "AEC +",
           x = min(pzc_data$pH), y = 0.2) +
  annotate(geom = 'text',
           label = "CEC -",
           x = min(pzc_data$pH), y = -0.2) +
  scale_x_continuous(breaks = seq(0, 14, 0.5)) +
  scale_linetype_manual(values = c(2, 1, 3)) +
  labs(title = "Point of Zero Charge",
       x = "pH",
       y = "Net Charge",
       linetype = NULL) +
  theme(legend.position = c(0.95, 1))