Code
library(tidyverse)
library(readxl)
library(nlraa)
library(soiltestcorr)

theme_set(theme_minimal(base_size = 14))

devtools::source_url("https://raw.githubusercontent.com/austinwpearce/SoilTestCocaCola/main/lin_plateau.R")Disclaimer: I’m a part of some ongoing work with FRST that will be published later this year. This post is written to not detract or distract from that important effort. This post is just thinking out loud.
Think about farm soils in a region that inherently have a wide range in soil test nutrient concentrations, no fertilizer just recently added. Across many sites, these concentrations probably go from relatively low (failing to meet the growing crop’s nutrient requirement) to relatively high (exceeding the crop’s uptake ability). At low soil test values, you’d expect a crop yield response after adding fertilizer to the soil to boost the availability of the nutrient. At a high value, you’d expect no response to additional nutrient by fertilizer.
Somewhere in between low and high soil test values, the probability that the crop responds to fertilizer drops. Additionally, the increase in yield that can be gained by adding fertilizer is also expected to diminish as soil test concentrations increase.
In this context, a critical soil test value (CSTV) would represent the approximate soil test concentration at which farmers in a region should generally stop applying fertilizer.
However, the actual determination of this regional CSTV can vary based on specific interpretations or expectations of the researcher doing the soil test correlation.
Is CSTV the value above which the probability of crop response to added fertilizer is
0%?
less than, say, 5%?
Is CSTV determined by
response data? (ANOVA of treatment yield means)
an inflection point of a model?
a predetermined point on the model?
a predetermined intercept with the model?
which model?
Should CSTV actually be a range of concentrations, and not a single value?
The challenge of estimating critical soil test concentrations has been around more than 30 years (Cox 1992; Mallarino and Blackmer 1992). And we even see parallels in other fields (Sand et al. 2005).
I wouldn’t consider myself an expert in fertilizer rate calibration trials. I have never even planned out and conducted a multi-year, multi-site experiment. I am knowledgable in soil testing, and I have helped other experts to think through some of these components of soil test correlation. In fact, I still find myself thinking about the theory and methods.
library(tidyverse)
library(readxl)
library(nlraa)
library(soiltestcorr)
theme_set(theme_minimal(base_size = 14))
devtools::source_url("https://raw.githubusercontent.com/austinwpearce/SoilTestCocaCola/main/lin_plateau.R")In the following exercise, I want to focus less on regression models and more on the probability of a crop response in getting a sense of the CSTV of a dataset.
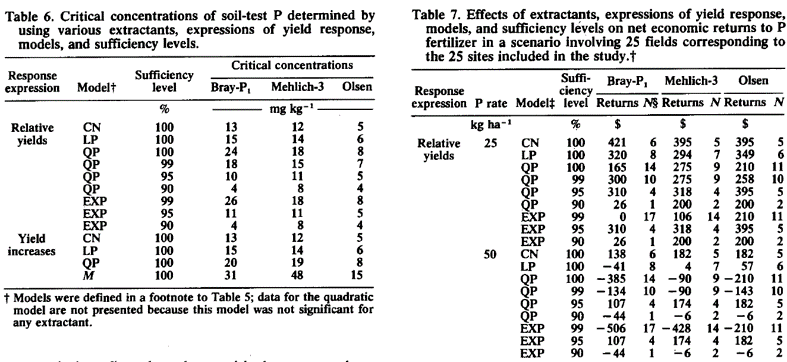
Let’s start by expressing crop yield response in relative yield (RY) terms (such as the yield of the control as a percentage of the maximum attainable yield). Subtracting RY from 100, we can calculate the percent of yield increase.
stv <- seq(0, 100, 1)
a <- 100
b <- 0
c <- 0.05
ry <- a + (b - a) * exp(-c * stv)

plot_01 <- tibble(stv, ry) |>
  mutate(pct_inc = 100 - ry) |>
  pivot_longer(ry:pct_inc, names_to = "metric") |>
  ggplot() +
  geom_line(aes(stv, value, color = metric)) +
  labs(x = "Soil Test Concentration",
       y = "Relative Yield (%)") +
  scale_y_continuous(
    breaks = seq(0, 100, 10),
    sec.axis = sec_axis(trans = ~ . * 1, name = "Percent response"))

plot_01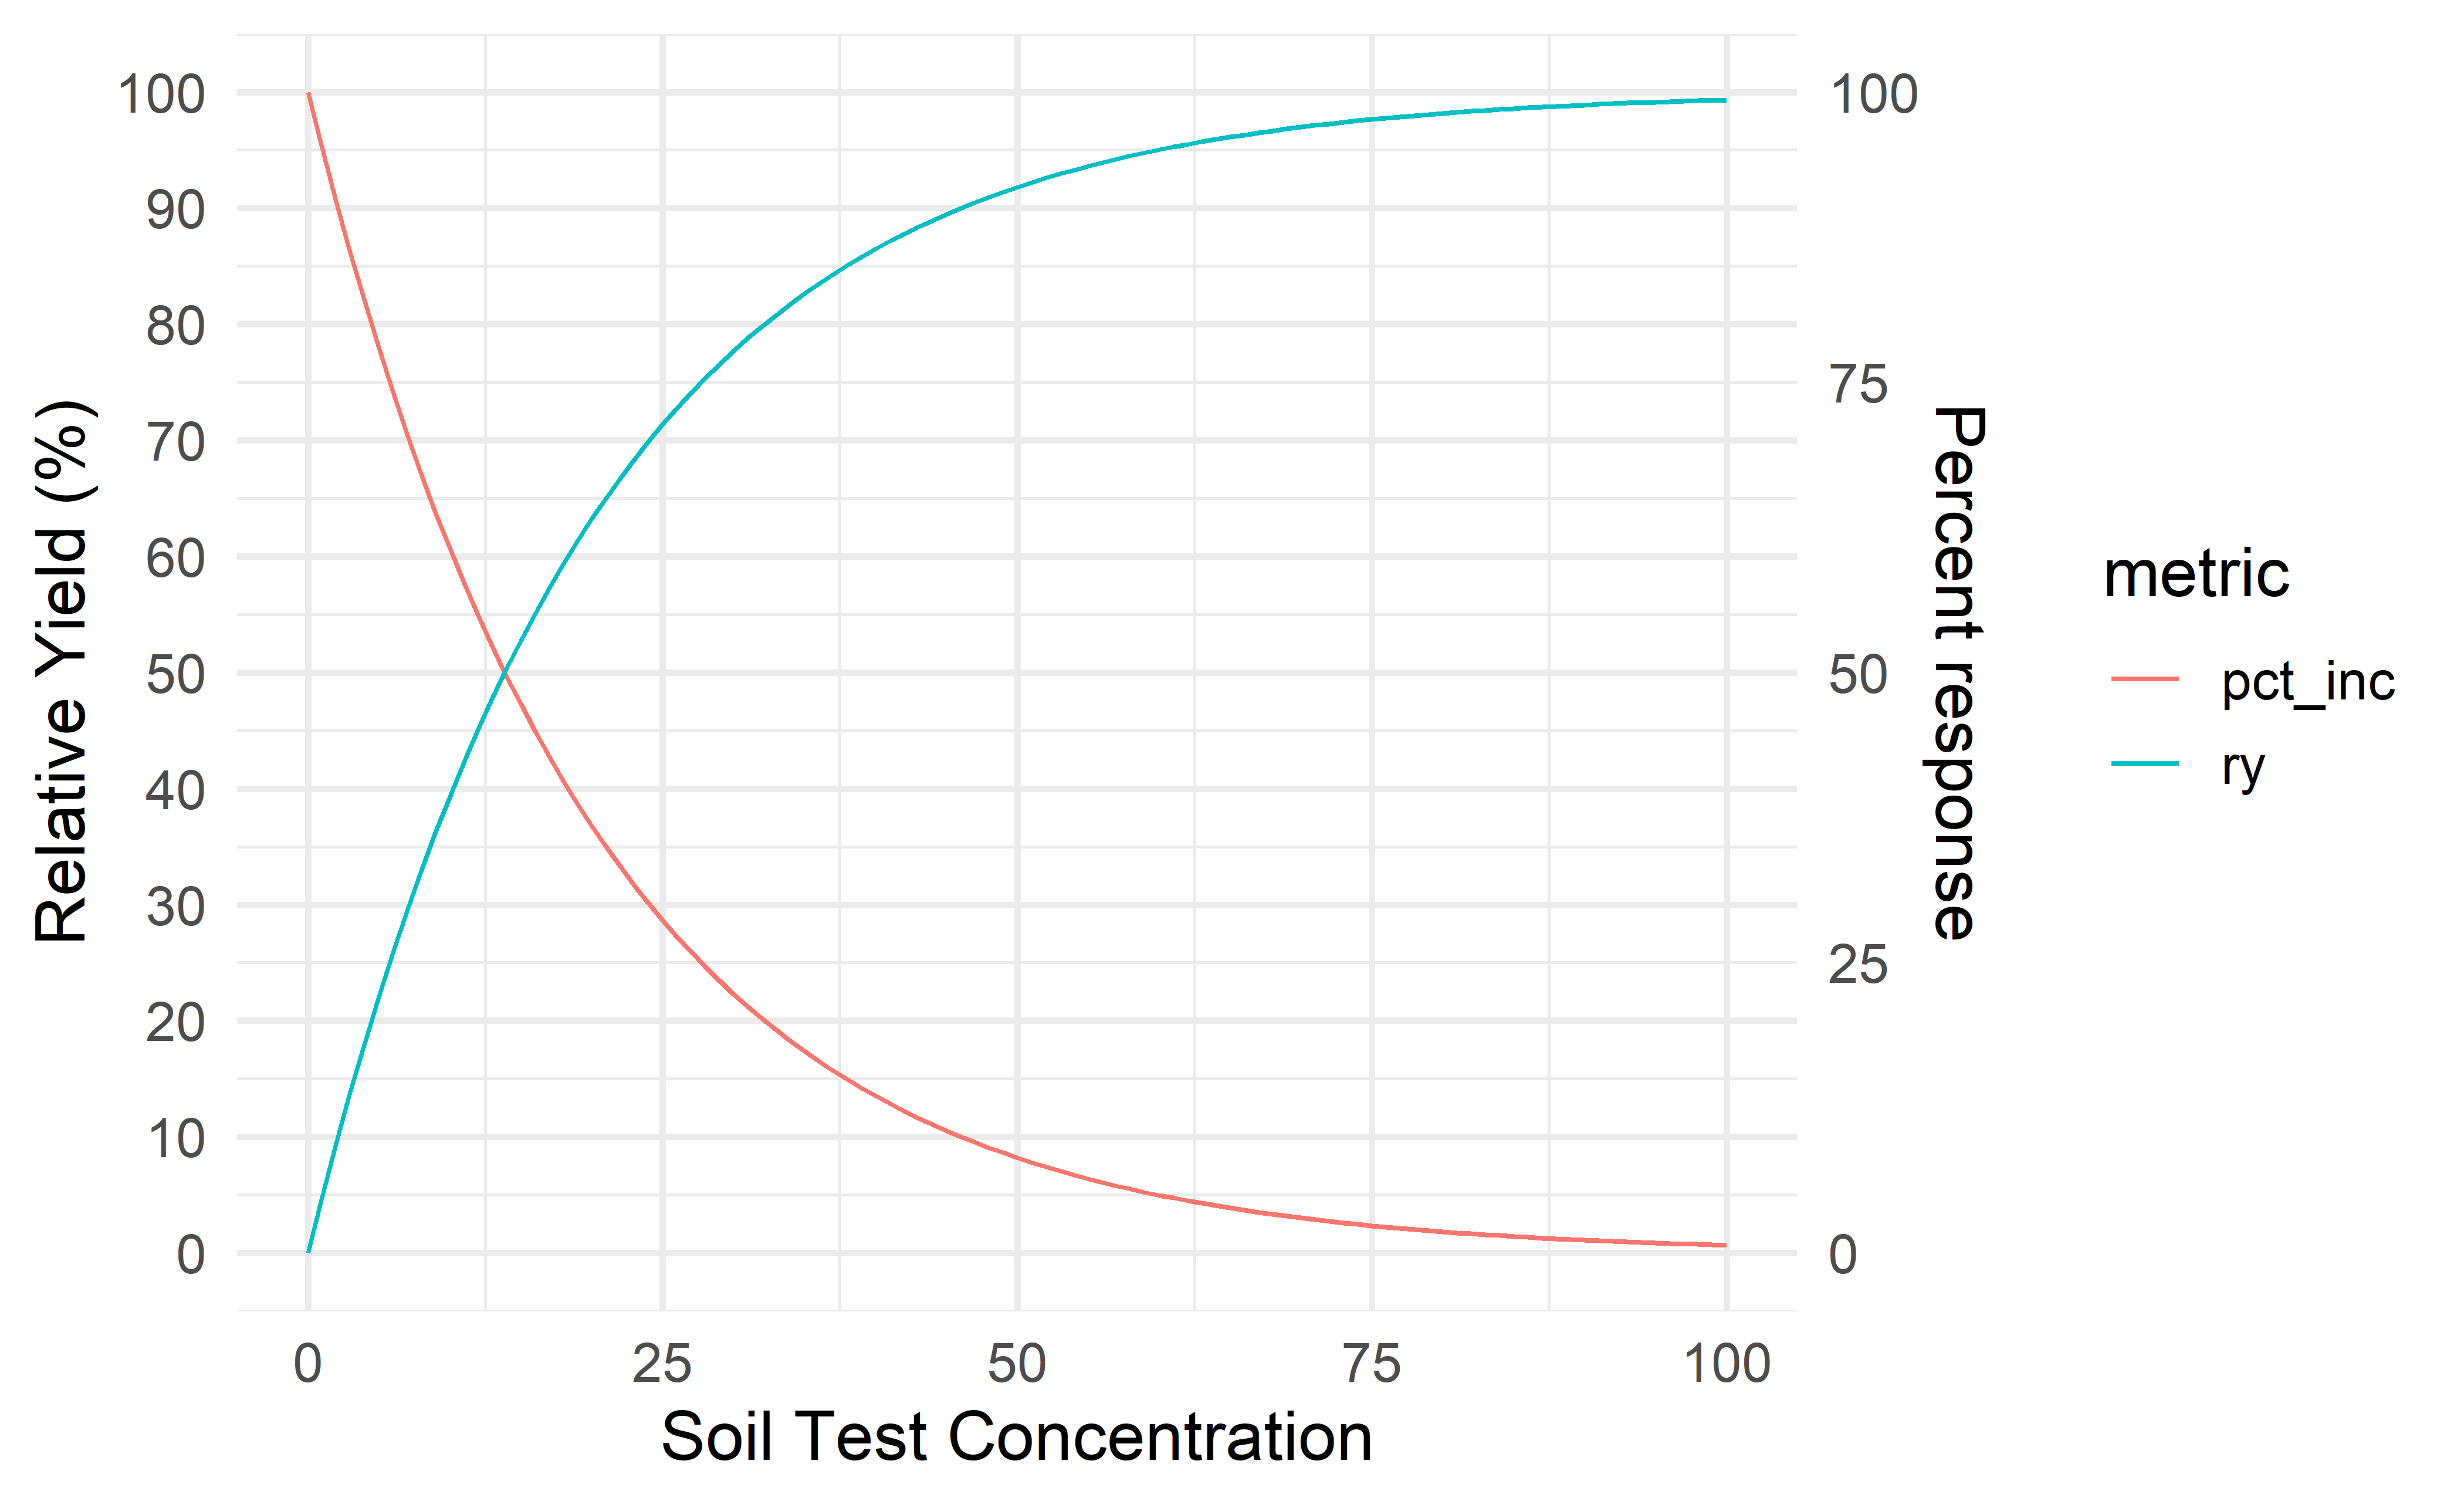
We can imagine that at some soil test concentration, the cost of adding fertilizer for a minimal response is just not worth it. Is that point at 90% RY? 95%? That’ll depend somewhat on fertilizer prices, but even in terms of labor and environmental losses it may not make sense chasing that last 5% yield increase.
But a 5% yield increase is money! Sure, but what is the probability of the 5% yield increase? Is there a 90% chance you’d see the 5% yield increase? Or just a 20% chance.
corr_01 <- read_xlsx("datasets.xlsx", sheet = "dataset-01")
corr_02 <- read_xlsx("datasets.xlsx", sheet = "dataset-02")
corr_df <- bind_rows(corr_01, corr_02) |>
  pivot_longer(sum_responsive:pct_resp_last_10, names_to = "metric")

head(corr_01) %>% knitr::kable()| dataset | rate | stv | ry | p_value | sig_response | sum_responsive | pct_resp_below_stv | prob_nearest_10 | pct_resp_last_10 |
|---|---|---|---|---|---|---|---|---|---|
| dataset-01 | 0 | 16 | 32.9 | 0.0001 | Responsive | 1 | 1 | 0.97253 | 1 |
| dataset-01 | 0 | 17 | 22.2 | 0.0001 | Responsive | 2 | 1 | 0.97253 | 1 |
| dataset-01 | 0 | 22 | 41.8 | 0.0002 | Responsive | 3 | 1 | 0.97253 | 1 |
| dataset-01 | 0 | 26 | 64.1 | 0.0016 | Responsive | 4 | 1 | 0.97253 | 1 |
| dataset-01 | 0 | 27 | 58.9 | 0.0021 | Responsive | 5 | 1 | 0.97253 | 1 |
| dataset-01 | 0 | 28 | 68.4 | 0.0670 | Responsive | 6 | 1 | 0.97253 | 1 |
corr_df |>
    ggplot(aes(x = stv, y = ry, color = sig_response)) +
    geom_point(size = 2) +
    facet_wrap(vars(dataset), scales = "free_x")
Both datasets use p < 0.1 to categorize the crop at a certain site as being “responsive” to fertilizer, meaning that the yield of the control was significantly less than the yield of some other treatment. I created four new variables in Excel1.
1 I started tinkering with the data in Excel, and gave up converting my work to R. Sorry.
sum_responsive: how many sites are “responsive” up to the current soil test value?
pct_resp_below_stv: what percentage of sites below the current soil test value were responsive?
prob_nearest_10: what is the average probability of response in the 10 nearest neighbors (by order of soil test value)?
pct_resp_last_10: what percentage of the last 10 sites below the current soil test value were “responsive”?
Can these new variables shed light on a possible CSTV for these two datasets? How would that compare with conventional regression models?
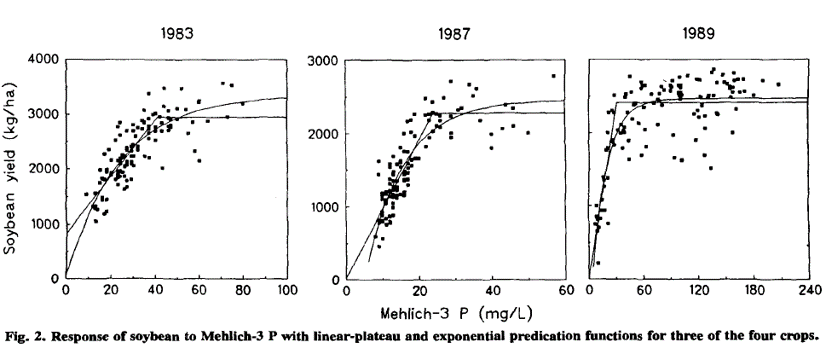
What would the CSTV be using a conventional linear-plateau model? The inflection point represents the CSTV, which in this case could be interpreted as the soil test value at which the probability of response instantly goes from positive to zero. It looks like this:
plot_02 <- lin_plateau(corr_01, stv, ry, plot = TRUE, color = corr_01$sig_response)
plot_02 +
  scale_color_discrete(name = "") +
  theme(legend.position = "top")
plot_03 <- lin_plateau(corr_02, stv, ry, plot = TRUE, color = corr_02$sig_response)
plot_03 +
  scale_color_discrete(name = "") +
  theme(legend.position = "top")
The respective CSTV are 46 and 121 ppm. Those may well be reasonable estimates. However, probabilities of response are not considered in the models. Would this be important to consider in the second dataset (right) in which is there is more overlap between “responsive” and “unresponsive” points?
Let’s look at the plots using the new variables I created (in Excel) based on the p-values that represent statistically significant, positive response to added fertilizer. Smoothing line represents overall trend.
# add variable for CSTV reference line
corr_df <- corr_df |>
  mutate(cstv = if_else(dataset == "dataset-01", 46, 121))

plot_all <- corr_df |>
  ggplot(aes(stv, value)) +
  geom_point(aes(color = sig_response)) +
  geom_smooth(se = FALSE, linewidth = 0.5) +
  geom_vline(aes(xintercept = cstv),
             color = "#002255",
             alpha = 0.2) +
  facet_wrap(vars(dataset, metric), ncol = 4, scales = "free")
What can we see here?
More to write…
If we use “responsiveness” as the outcome, could logistic regression point to a critical soil test value?
corr_df <- corr_df |>
  mutate(responsive = if_else(sig_response == "Responsive", 1, 0))

# Alternative correlation
corr_df |>
    ggplot(aes(x = stv, y = responsive)) +
    geom_point(size = 2, aes(color = sig_response)) +
    stat_smooth(method = "glm",
                method.args = list(family = "binomial"),
                se=TRUE) +
    geom_vline(aes(xintercept = cstv),
             color = "#002255",
             alpha = 0.2) +
    facet_wrap(vars(dataset), scales = "free_x") +
  labs(x = "Soil Test Concentration",
       y = "Responsive?") +
  scale_color_discrete(name = "") +
  theme(legend.position = "top")
Could we use the inflection point to represent the CSTV? Or what about the soil test value at 0.5?
How would we use this model in calibrating fertilizer rates? Haven’t thought that far.